
How do breakeven trades affect profit factor?
A zero-result trade changes neither gross profit nor gross loss, so it does not change profit factor. It still uses time, may incur costs and changes the average result per recorded trade. That is why profit factor should be read beside expectancy, trade count and costs.
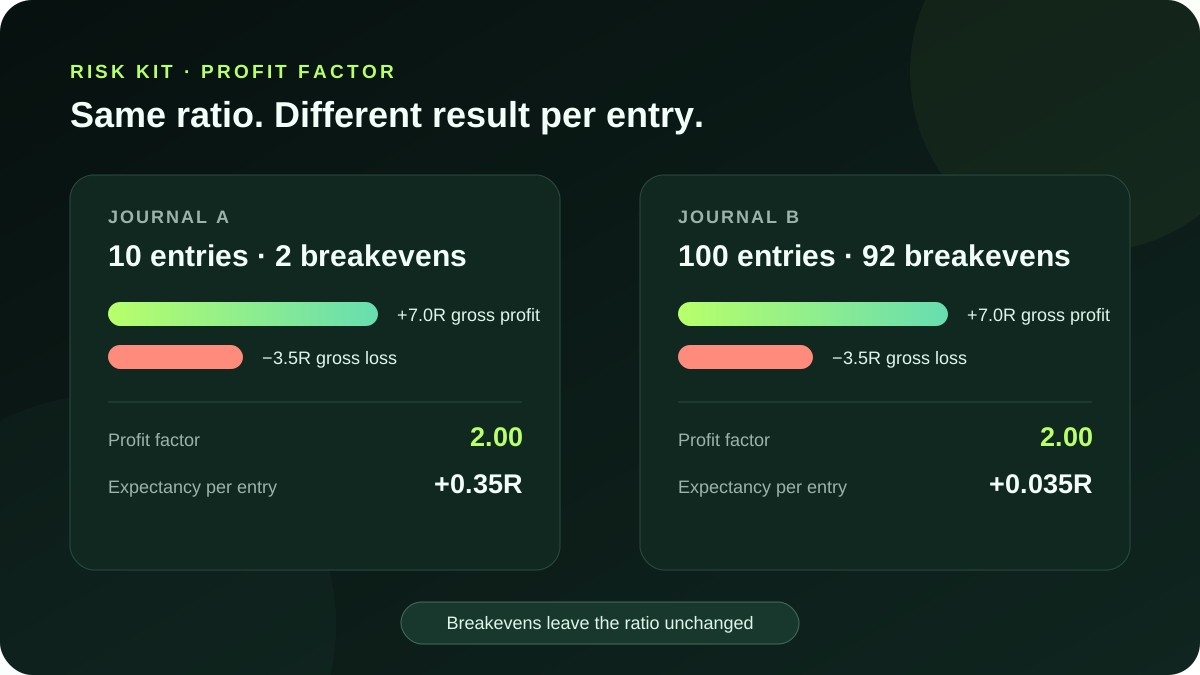
Profit factor = gross profit ÷ absolute gross loss. For the 10-trade example below, 7.0R of winning results divided by 3.5R of losing results gives a profit factor of 2.00. Two exact 0R trades do not enter either side of that division. They do, however, reduce average realised expectancy from 0.4375R per non-breakeven decision to 0.35R per recorded trade.
What goes into profit factor?
Profit factor compares the sum of positive results with the magnitude of the sum of negative results over the same sample. In R-multiples, add every result above zero to get gross profit. Add the absolute values of every result below zero to get gross loss. Then divide:
Profit factor = Σ positive R ÷ |Σ negative R|
A value above 1 means the sample's gross gains exceeded its gross losses. A value below 1 means gross losses were larger. If there are no losses, the denominator is zero and the ratio is undefined rather than proof of an infinite, permanent edge.
An exact 0R result belongs to neither sum. Do not quietly call a small net loss “breakeven”: if commissions, spread, slippage or financing turn the completed result into −0.04R, record −0.04R. Investor.gov defines the difference between bid and ask as the spread, and the SEC's investor bulletin explains that transaction fees reduce investment results. Use the net result your records actually support.
A 10-trade worked example in R
Assume 1R is the amount planned at risk before each trade. The following completed results are hypothetical and already net of any costs the trader chose to include:
| Trade | Result | Classification |
|---|---|---|
| 1 | +2.0R | Win |
| 2 | +1.5R | Win |
| 3 | +0.5R | Win |
| 4 | −1.0R | Loss |
| 5 | −1.0R | Loss |
| 6 | −0.5R | Loss |
| 7 | 0.0R | Breakeven |
| 8 | 0.0R | Breakeven |
| 9 | +3.0R | Win |
| 10 | −1.0R | Loss |
The four wins total 2.0 + 1.5 + 0.5 + 3.0 = 7.0R gross profit. The absolute losses total 1.0 + 1.0 + 0.5 + 1.0 = 3.5R gross loss. Profit factor is therefore 7.0 ÷ 3.5 = 2.00. Net result is 7.0 − 3.5 = +3.5R.
There are 10 recorded trades, so the arithmetic mean is 3.5R ÷ 10 = +0.35R per recorded trade. If you report win rate the way the RiskKit Trade Journal does—excluding exact breakevens—the rate is four wins ÷ eight wins-and-losses = 50%. State that convention because another journal may divide four wins by all 10 entries and report 40%.
Why profit factor and expectancy are not interchangeable
For a sample with no breakeven trades, profit factor can be reconstructed from win frequency, loss frequency, average win and average loss. But profit factor is a ratio of pooled magnitudes. Expectancy is a result per observation, so the denominator—the number of entries—matters.
In the worked sample, the average win is 7.0R ÷ 4 = 1.75R, and the average loss magnitude is 3.5R ÷ 4 = 0.875R. Looking only at the eight non-breakeven outcomes gives 50% × 1.75R − 50% × 0.875R = +0.4375R per decision. Multiplying by the 80% share of all entries that were wins or losses gives 0.4375R × 0.8 = +0.35R per recorded trade, matching the direct average.
Now imagine copying the same eight wins and losses into a 100-entry journal with 92 exact breakevens. Gross profit and gross loss remain 7.0R and 3.5R, so profit factor remains 2.00. Net result remains +3.5R, but the average becomes only +0.035R per entry. This does not make the first journal “better” without context—holding periods, opportunity frequency, capacity, risk and costs may differ—but it proves that profit factor alone does not describe the rate at which an edge is realised.
Use the Trading Expectancy Calculator to examine win rate and average payoff together. It uses a simplified binary win/loss model, so if breakevens are material, calculate the direct mean of all net R results as well.
What a high profit factor can hide
- A small sample: one unusually large winner can dominate gross profit. Remove the +3.0R trade from the example and gross profit falls to 4.0R, so profit factor falls from 2.00 to about 1.14.
- Many low-information entries: breakevens do not change the ratio, but they may reflect capital, time and transaction costs. They also affect the result per recorded trade.
- Uneven risk: R-multiples are comparable only if the definition of 1R is consistent. Changing the risk unit after seeing outcomes can distort the record.
- Tail losses: an unfilled stop or gap can be much worse than −1R. A short sample may simply not contain the event that matters most.
- Changing conditions: pooling different strategy versions, instruments or market regimes can create one attractive ratio that describes none of them well.
- Backtest assumptions: hypothetical fills may omit liquidity, spread and execution effects. The CFTC warns about hypothetical trading results because trades not executed under actual market conditions may over- or underestimate performance.
Profit factor is descriptive, not a confidence statement. It does not tell you the probability that future profit factor will stay above 1. The separate RiskKit guide on sample size and win-rate uncertainty shows why even one component of a trading record can remain imprecise.
A reproducible journal workflow
- Choose a fixed definition of 1R before recording results, usually the planned loss from entry to initial stop plus the costs you intend to include.
- Record the realised net R for every eligible completed trade. Keep exact zeros separate rather than forcing them into wins or losses.
- Sum positive R, sum the absolute value of negative R, and divide to get profit factor. If gross loss is zero, report the ratio as undefined.
- Also report trade count, breakeven count, net R, arithmetic mean R per entry, win rate convention, average win, average loss and maximum drawdown.
- Split results by rule version or relevant regime only when that split was defined honestly; avoid searching many slices and showcasing only the best one.
- Stress-test weaker inputs and different sequences with the Fixed Risk Simulator. A simulation explores consequences of assumptions; it does not validate the source data.
The RiskKit Trade Journal calculates profit factor and realised expectancy in your browser from the R-multiples you enter. Its statistics are descriptive summaries, and the entries stay on that browser profile unless you export them. Preserve your own raw records so you can reproduce each total independently.