How much risk per trade is too much?
A 5,000-path Monte Carlo study of fixed cash, turnover, fixed fractional and fractional Kelly sizing shows why the risk base matters as much as the percentage.
There is no universal safe risk percentage. Under this study's deliberately modest hypothetical edge, quarter Kelly (0.8333%) produced the lowest P95 drawdown, while half Kelly (1.6667%) produced more upside and far deeper tail drawdown. The useful limit is the largest risk whose poor sequence you could still follow—not the setting with the most attractive best case.
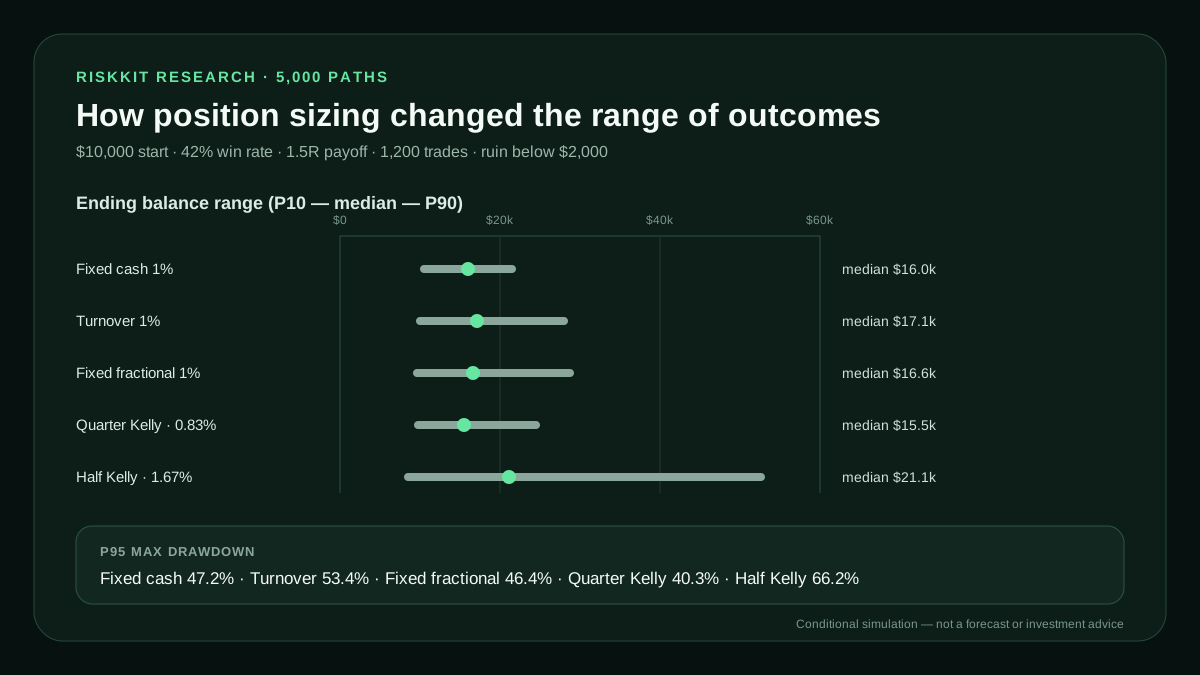
Why “risk 1%” is not a complete rule
Two traders can both say they risk 1% and still have different loss behaviour. One may risk $100 on every trade because the account started at $10,000. Another may recalculate 1% from current equity after every result. A third may keep risk fixed until a 25% turnover target is reached, then reset the cash base.
Those rules diverge during drawdowns. If a constant $100 loss continues after equity falls to $5,000, the next loss is 2% of current equity. A 1%-of-current-equity rule contracts to $50. This does not make fixed fractional sizing harmless; it changes how quickly risk expands or contracts.
CME Group's lesson on proper position size identifies two essential inputs: the stop location and the amount or percentage of the account the trader is willing to risk. The study below holds the trading edge constant and changes only how that second input is translated into cash risk.
A numeric example you can reproduce
Every scenario started with $10,000 and ran 5,000 independent paths. Each path contained 1,200 binary trades: 20 trades per month for 60 months. A win earned 1.5 times the cash risk; a loss removed the cash risk. The hypothetical win rate was 42%, producing +0.05R expectancy per trade before fees, spread, slippage and taxes.
| Input | Study value |
|---|---|
| Starting balance | $10,000 |
| Win rate / reward:risk | 42% / 1.5R |
| Trades / horizon | 1,200 / 60 months |
| Paths per sizing rule | 5,000 |
| Ruin floor / growth target | $2,000 / $50,000 |
| Pseudo-random seed | 20261002 |
The simplified full-Kelly fraction is (1.5 × 0.42 − 0.58) ÷ 1.5 = 3.3333%. Quarter Kelly therefore risks 0.8333% of current equity; half Kelly risks 1.6667%.
The same pseudo-random sequence is reused for each sizing rule, so differences come from the sizing method rather than luckier input paths. The source script stops a path after it crosses the ruin floor and records the first month it reaches the target.
Results across 5,000 paths
| Sizing rule | Risk | P10 finish | Median | P90 finish | P95 drawdown | Ruin | Hit 5× |
|---|---|---|---|---|---|---|---|
| Fixed cash from starting balance | 1.00% | $10,500 | $16,000 | $21,500 | 47.2% | 0.26% | 0.00% |
| Fixed cash + 25% turnover step | 1.00% | $10,000 | $17,146 | $28,032 | 53.4% | 0.32% | 0.26% |
| Fixed fractional of current equity | 1.00% | $9,610 | $16,633 | $28,791 | 46.4% | 0.00% | 0.76% |
| Quarter Kelly | 0.8333% | $9,795 | $15,475 | $24,450 | 40.3% | 0.00% | 0.08% |
| Half Kelly | 1.6667% | $8,473 | $21,113 | $52,610 | 66.2% | 0.18% | 16.28% |
P10, median and P90 are the 10th, 50th and 90th percentile final balances. P95 maximum drawdown is the level that 95% of simulated paths did not exceed. It is a tail-risk summary inside this model, not a boundary for live trading.
What the comparison reveals
One percent can produce several risk profiles
The first three rows all display 1%, yet turnover produced the deepest P95 drawdown at 53.4%. Fixed fractional risk contracted with equity and did not hit the $2,000 ruin floor in this sample, although its poor-case finish and 46.4% tail drawdown were still severe.
Quarter Kelly was more conservative here—not everywhere
Quarter Kelly risked only 0.8333% because full Kelly was low under the stated edge. It traded lower median growth for the smallest P95 drawdown in the table. If win rate or payoff is overstated, fractional Kelly still sizes from a false edge; scaling an unreliable estimate does not repair it.
More upside came with a much weaker tail
Half Kelly produced the highest median and P90 balances, but also the weakest P10 balance and a 66.2% P95 drawdown. A trader who cannot continue after losing two-thirds from a prior peak cannot capture the later compounding assumed by that path.
Kelly's original 1956 paper, A New Interpretation of Information Rate, derives a growth-maximizing approach for repeated bets under known probabilities. Market probabilities are estimated rather than known, which is one reason traders often examine fractional Kelly instead of treating the full fraction as an instruction.
A target date needs a target-hit rate
Half Kelly reached $50,000 in 16.28% of paths. Among that successful subset, the median first hit was month 48. It would be misleading to report “four years to $50,000” without saying that 83.72% of paths never reached the target during the five-year horizon.
The 1% fixed-fractional rule reached the target in only 0.76% of paths; the turnover rule did so in 0.26%. Fixed cash without turnover never reached it. Always read time-to-target beside target probability, ruin rate and drawdown.
For long-horizon investors, the SEC's Investor.gov introduction to investing separates compound growth from risk management and notes that all investments involve risk. A leveraged trading simulation is not a substitute for diversified long-term investing, emergency savings or a plan matched to personal risk tolerance.
Stress-test your own assumptions
Fixed Risk Monte Carlo
Compare constant cash risk, turnover step-ups and a percentage of current equity. Keep win rate and payoff unchanged, then lower risk until the stressed drawdown is tolerable.
Test your fixed-risk assumptions →Kelly Monte Carlo
Calculate full Kelly from your edge, apply a fractional Kelly multiplier and cap maximum risk. Test conservative inputs as well as the historical estimate.
Stress-test fractional Kelly sizing →Start with a measured sample of completed trades, then rerun with a lower win rate, smaller average winner and realistic costs. Our guide to interpreting Monte Carlo paths explains why the median path is more useful than selecting the most attractive run.
Model limitations
This is a simplified educational model, not a forecast. Outcomes are independent Bernoulli trials with a constant win probability and one fixed payoff for every winner. Live results may contain clustered losses, serial correlation, fat tails, gaps, partial exits and changing market regimes.
The model excludes spread, commissions, slippage, financing, taxes, liquidity limits, leverage and margin rules, deposits, withdrawals and strategy decay. It assumes 20 trades arrive every month and that the estimated edge survives for 1,200 trades. A small +0.05R pre-cost edge could become negative after costs.
Only 5,000 paths were sampled for each rule. Observed zero ruin means zero paths crossed the selected floor in this sample; it does not mean the true probability is zero. The study also tests only one win-rate/payoff pair, one horizon and a limited set of sizing rules.
Monte Carlo simulation can expose sequence risk under stated assumptions. It cannot establish that an edge exists or will persist. CME Group's risk-management lesson recommends defining leverage, maximum trade loss and maximum day loss as explicit parts of a trade plan; simulation is one input to that process.